Data Vault Principles

marp: true

theme: gaia

class: lead paginate: true backgroundColor: #fff header: Data Warehouse Fundamental (longdatadevlog) footer: “https://longdatadevlog.com” style: | .fa-twitter { color: aqua; } .fa-mastodon { color: purple; } .fa-linkedin { color: blue; } .fa-window-maximize { color: skyblue; } @import ‘https://cdnjs.cloudflare.com/ajax/libs/font-awesome/6.3.0/css/all.min.css’; /* Apply Ubuntu Mono font to the entire slide */ section { font-family: ‘Ubuntu Mono’, monospace; } header { text-align: left; }

section { font-size: 24px; /* Global change to paragraph text size / } h1 { font-size: 56px; / Global change to H1 heading size / } h2 { font-size: 48px; / Global change to H2 heading size / } h3 { font-size: 36px; / Global change to H3 heading size */ } —

bg right

Data Warehouse Fundamental Knowledge

Presenter: Long Bui - longddl

Blog: longdatadevlog.com GitHub: /longbuivan


Mastering Data Warehousing

Welcome to everyone to this guide to Data Warehousing 101, Fundamental for Everything Else! In this course, we’ll navigate key concepts, design principles, and real-world applications to equip you with essential Data Warehousing skills.


Section 1: Welcome

This is a part of Data Engineering Course 101

bg:right w:500


Lecture 1. Welcome

  • Objectives:
    • Understand Data Warehousing fundamentals.
    • Learn to build and manage scalable data systems.
  • Course Flow:
    • Core Concepts
    • Architecture
    • ETL and Data Modeling

Lecture 2. About This Course

  • Audience:
    • Data professionals, analysts, engineers.
  • Prerequisites:
    • Basic understanding of databases and SQL.
Topic Description
Data Warehouse Architecture Overview of key components and structures
ETL Processes Extract, Transform, Load operations for data movement
Data Modeling Methods to model, organize data in warehouse

Lecture 3. Reflection: The Value of Data Warehousing

  • Why Data Warehousing?: Serves as the backbone of data-driven decision-making.

Key Points:

  • Centralized data repository
  • Historical data analysis
  • Support for complex queries and analytical purpose
  • Enhanced data quality
  • Integration of disparate sources like a Data Fabric

Data Storing Evolution

Data storage techniques have evolved due to:

  • Increasing data volumes and complexity
  • Need for faster query performance
  • Desire for more flexible data analysis
  • Advancements in cloud computing and distributed systems
  • Requirements for real-time analytics and streaming data
  • Growing importance of unstructured and semi-structured data

This evolution reflects the changing needs of businesses and improvements in technology, allowing for more efficient and versatile data management solutions. Data Warehousing Technique changed: DB –> DW –> DL –> LH

pie title Data Warehousing Evolution "Databases": 40 "Data Warehouse": 30 "Data Lakes": 20 "Lakehouses": 10

Section 2: Data Warehousing (DWH) Concepts


Lecture 4. Introduction to DWH

A centralized repository for structured data.

  • Characteristics:

    • On-top of Databases
    • As a copied data, not moved (except the migrations)
    • Optimized for query and reporting.
    • Stores historical data for analysis.
  • Warehouse Capability:

    • Integrated
    • Subject oriented
    • Time variant
    • Non volatile

Make Warehouse being Improved

Make data-drivent decisions: Past, Present, Future, The unknown

Benefit Description
Centralized Data Single source of truth for decision-making
Historical Reporting Analyze trends over time
Query Optimization Faster, more efficient query execution
BI + Warehouse => Best Value (Databricks Lakehouse)

Lecture 5. What is a Data Warehouse?

Feature Traditional DBs (OLTP) Data Warehouse (OLAP)
Purpose Real-time transaction Analytical
Data Structure Highly normalized Denormalized for speed
Query Complexity Simple transactions Complex and aggregated
Read/Write Operations Balanced read/write Mostly read-heavy
Storage Model Row-based Columnar for performance
Time Span Short-term data Long-term historical data

From Traditional Database to OLAP

  • Traditional databases directly support operational reports.
  • Data warehouses are fed by ETL pipelines and serve analytical tools.
  • Sometime: Cubes are on top of OLAP
flowchart LR A[Operational Systems] --> B[ETL Process] E[Traditional DBs] --> B B --> C[Data Warehouse] C --> K[Data Marts] K --> D[BI Tools] E --> F[Operational Reports] F -.-> D

Lecture 6. Reasons for You to Build a Data Warehouse

Benefit Description
Centralized Data Single source of truth
Historical Reporting Analyze trends over time
Query Optimization Faster query execution
Data Integration Consolidate data from multiple sources
Improved Decision-Making Enable data-driven strategies
Performance Optimization Enhance query speed for large datasets

Lecture 7. Compare a Data Warehouse to a Data lake

Aspect Data Warehouse Data Lake
Data Structure Structured, optimized for queries Raw, unstructured, scalable storage
Schema Schema-on-write Schema-on-read
Usage Historical data analysis Store all types of data

Lecture 8. Compare a Data Warehouse to Data Virtualization

Aspect Data Warehouse Data Virtualization
Data Storage Physical storage Logical access
Data Movement ETL required Real-time access
Data Integration Historical data No physical data movement

Lecture 9. Look at a Simple End-to-End Data Warehousing Environment

  1. Data Sources
  2. ETL/ELT
  3. Data Warehouse
  4. Data Marts
  5. BI Tools

Data Flows of Marketting

flowchart TD subgraph DS[Data Sources] A1[CRM Systems] A2[Web Analytics] A3[Social Media] A4[Email Marketing] A5[Ad Platforms] A6[ERP Systems] end subgraph ETL[ETL/ELT Process] B1[Extract Data] B2[Transform & Cleanse] B3[Load into DW] end subgraph DW[Data Warehouse] D1[Customer Data] D2[Sales Data] D3[Campaign Data] D4[Financial Data] end subgraph RL[Reporting Layer] F1[Marketing Reports] F2[Customer Segmentation] F3[ROI Analysis] F4[Campaign Performance] end DS --> ETL --> DW --> RL

Lecture 10. Summarize Data Warehousing Concepts

  • Core Concepts Recap
  • Real-World Applications
  • Integration with Modern Technologies

Quiz 1: Data Warehousing Concepts**


Question 1: You are a data engineer at a retail company. Your team is designing a data warehouse to track customer purchases and product inventory. The company wants to ensure that the warehouse can handle a high volume of daily transactions and provide reports on product availability in real time. What should you focus on during the design process?

Select the best answer:

  1. Prioritize data extraction from social media platforms.
  2. Design the warehouse to store large amounts of historical data and support complex queries.
  3. Ensure the data warehouse supports frequent real-time data updates and optimized transaction processing.
  4. Focus on integrating third-party data sources like external market trends.

Question 2: Your marketing team wants to analyze customer behavior patterns to create personalized campaigns. They need to quickly access customer purchase history, preferences, and demographic data. The data is coming from multiple sources, including the CRM, website, and mobile app. Which of the following strategies will best meet their needs?

Select the best answer:

  1. Set up multiple, disconnected databases to store data from each source separately.
  2. Build a data warehouse that consolidates all customer data from different sources, enabling quick retrieval for analytics.
  3. Use a flat file system to store data, and process it manually each time they need insights.
  4. Recommend the team hire external consultants for data analysis.

Question 3: You are responsible for maintaining the data warehouse of a logistics company. Recently, the company has been struggling with long query response times when generating reports about delivery status and customer orders. The issue is slowing down decision-making. What is the most effective solution to address this problem?

Select the best answer:

  1. Expand the size of the data warehouse by adding more storage capacity.
  2. Implement data indexing and partitioning to improve query performance.
  3. Reduce the number of reports generated by the team.
  4. Switch to a NoSQL database to replace the data warehouse.

Section 3: Data Warehousing Architecture


Lecture 11. Introduction to Data Warehousing Architecture

Key Components:

  1. Source Systems
  2. Staging Area
  3. Presentation Layer
graph LR A[Source Systems] --> B[ETL Process] B --> C[Staging Area] C --> D[Data Warehouse] D --> E[Data Marts/BI Tools]

Lecture 12. Build a Centralized Data Warehouse

  • Design Steps:
    1. Identify Data Sources
    2. Design Fact and Dimension Tables
    3. Create an ETL Pipeline
Source System Data Type Integration Method
CRM Customer Information ETL
ERP Transactional Data API Integration
Web Analytics Clickstream Data Batch Processing

Lecture 13. Compare a Data Warehouse to a Data Mart

Aspect Data Warehouse Data Mart
Scope Enterprise-wide Departmental or functional area
Data Storage Integrated Specialized for specific purposes
Complexity Complex, large-scale Simpler, smaller-scale

Suppliers (Sources) –> WholeSalers (Warehouses) –> Retailers (Marts)


Dependent vs. Independent Data Marts

Aspect Dependent Data Marts Independent Data Marts
Data Source Central data warehouse Various sources
Consistency High Potentially low
Implementation Top-down Bottom-up
Flexibility Less More
Maintenance Easier More challenging

Choose based on:

  • Organizational structure and needs
  • Data consistency requirements
  • Available resources and expertise
  • Long-term scalability plans

Lecture 14: Decide Which Component-Based Architecture is Your Best Fit

Component-Based Architectures:

  • Single-Tier: Simplest, all components in one layer
  • Two-Tier: Client-server model, separating presentation and data
  • Three-Tier: Presentation, application, and database layers

Component-Based Architecture in Data Platform Design:

  • Data Ingestion Layer: Handles data intake from various sources
  • Data Storage Layer: Manages raw and processed data storage
  • Data Processing Layer: Transforms and prepares data for analysis
  • Data Analytics Layer: Provides tools for data analysis and visualization
  • Data Governance Layer: Ensures data quality, security, and compliance

Benefits:

  • Modularity: Easy to update or replace individual components
  • Scalability: Can scale specific components as needed
  • Flexibility: Adapt to changing business requirements

Lecture 14: Decide Which Component-Based Architecture is Your Best Fit (Cnt)

graph TD A[Data Warehousing] A --> B[Centralized] A --> C[Component-Based] B --> D[DW] B --> E[Data lake] C --> F[Archiected] C --> G[Non-Archiected]

Decision Factors:

  • Complexity
  • Scalability
  • Maintenance

Choose Based On:

  • Business Needs: Size, complexity, and growth
  • Technical Requirements: Performance, security, and scalability

Lecture 15: Include Cubes in Your Data Warehousing Environment

  • OLAP Cubes: Multi-dimensional analysis
  • MOLAP: Multi-dimensional OLAP, pre-aggregated data
  • ROLAP: Relational OLAP, real-time data access

Benefits:

  • Faster Query Performance
  • Complex Calculations
  • Data Aggregation

Considerations:

  • Data Size: Choose MOLAP for pre-aggregated
  • Real-Time Needs: Choose ROLAP for live data

RDBMS + “Cube” ==> Getting Best Value


Lecture 16: Include Operational Data Stores in Your Data Warehousing Environment

Operational Data Stores (ODS) emphasis on current operational data

  • Purpose: Integration of real-time operational data
  • Role: Support daily operations and reporting

Why include ODS?

  • Integrates real-time operational data
  • Supports daily operational reporting
  • Provides a staging area for the data warehouse
  • Enables data cleansing and validation
  • Reduces load on transactional systems
  • Facilitates historical data analysis

ODS vs. Data Warehouse

flowchart LR Z[Data Sources] --> |Rapid ETL| A[ODS] Z --> |Batch ETL| D[Data Warehouse] A --> B[Operational Reporting] B --> C[Real-Time Data Access] C --> D D --> E[Historical Data Analysis]

Lecture 16: Include Operational Data Stores in Your Data Warehousing Environment

Benefits:

  • Real-Time Data Integration
  • Operational Reporting
  • Data Cleansing

Use Cases:

  • Transactional Systems: Real-time operational data
  • Operational Analytics: Daily business operations

Takeaways

flowchart LR B[BI] --> D[Data Warehouse] B --> L[Data Lake] B --> B[Data Virtualization] B --> C[ODS] D --> E((Best Value)) L --> E B --> E C --> E

Lecture 17: Explore the Role of the Staging Layer Inside a Data Warehouse

Function Purpose
Data Extraction Load raw data from source systems
Data Transformation Clean and standardize data
Data Loading Prepare data for data warehouse
flowchart LR subgraph S[Sources] CRM_raw Sale_raw end subgraph ST[Staging Layer] CRM_stg Sale_stg end CRM_raw --> CRM_stg Sale_raw --> Sale_stg subgraph DW[Data Warehouse] ST UA end subgraph UA[User Access Layer] Campaign Ads end CRM_stg --> Campaign Sale_stg --> Campaign CRM_stg --> Ads Sale_stg --> Ads

Lecture 18: Compare the Two Types of Staging Layers

Type Description Example Use
Local Staging Non-persistent temporary storage for processing Intermediate data in memory or temp files
Global Staging Persistent centralized data storage Enterprise-wide data in databases or data lakes

Benefits of Staging Layers:

  • Data Validation: Verify data quality before loading
  • Transformation: Prepare data for warehouse schema
  • Performance: Offload processing from source systems
  • Backup: Maintain a copy of raw data
  • Audit Trail: Track data lineage and changes
  • Scalability: Handle large data volumes efficiently
  • Error Handling: Isolate and manage data issues
  • Flexibility: Adapt to changes in source systems

Lecture 18: Compare the Two Types of Staging Layers

Aspect Local Staging Global Staging
Scope Limited to specific jobs Enterprise-wide
Data Access Short-term, job-specific Long-term, accessible
Complexity Less complex More complex

Staging Types for ETL vs ELT:

ETL ELT
Local Staging Global Staging
Temporary storage Persistent storage
Data transformation Data loading as-is
Limited data volume Large data volumes
Structured data focus All data types

Key Differences:

  • ETL often uses local staging for immediate processing
  • ELT leverages global staging for flexibility and scalability
  • ETL transforms data before loading, ELT after loading
  • ELT better suited for big data and cloud environments

Lecture 19: Summarize Data Warehousing Architecture

Data Warehousing Architecture

Component Role
Source Layer Data extraction from source systems
Staging Layer Intermediate data processing
Data Warehouse Centralized data storage
Presentation Layer Data access and reporting
flowchart LR A[Source Layer] --> B[Staging Layer] B --> C[Data Warehouse] C --> D[Presentation Layer]

Lecture 19: Summarize Data Warehousing Architecture

flowchart TD A[Source] --> B[Staging] B --> C[Data Warehouse] C --> D[Presentation] subgraph Design Architecture A B C D end subgraph Deliverables E[Diagram] F[Explanation] G[Rationale] end

Assignment: Data Warehousing Architecture

Question:

You are a data engineer at a retail company that wants to boost its marketing campaigns, improve product sales, and better target customers. Design a data warehouse architecture to support these goals.

Your task:

  1. Create a high-level design of the data warehouse architecture.
  2. Explain the key components and their roles.
  3. Justify your design choices.

Assignment: Data Warehousing Architecture

Solution:

[Provide your design and explanation here]

Key points to consider:

  • Data sources (e.g., CRM, sales systems, website analytics)
  • ETL/ELT processes
  • Data warehouse structure (e.g., star schema, snowflake schema)
  • Data marts for specific business areas
  • BI and analytics tools integration
  • Scalability and performance considerations

Your solution should demonstrate understanding of data warehousing concepts and how they apply to real-world business needs.


Section 4: Bring Data Into Your Data Warehouse


Lecture 20: Introduction to ETL and Data Movement for Data Warehousing

Component Purpose
ETL (Extract) Extract data from source systems
ETL (Transform) Transform data into the desired format
ETL (Load) Load data into the data warehouse

Lecture 21: Compare ETL to ELT

Aspect ETL ELT
Process Order Extract, Transform, Load Extract, Load, Transform
Performance Can be slower due to transformation before loading Often faster due to parallel processing
Flexibility Limited by processing power More flexible, leveraging target system processing

Example of ETL and ELT:

ETL Example:

  1. Extract customer data from CRM
  2. Transform: Clean addresses, standardize names
  3. Load into data warehouse

ELT Example:

  1. Extract sales data from POS system
  2. Load raw data into data lake
  3. Transform: Aggregate sales by product, region

Lecture 22: Design the Initial Load ETL

Stage Description
Initial Load Load all historical data into warehouse
Data Increment Incrementally Load data into warehouse
Data Mapping Map source data to warehouse schema
Validation Ensure data accuracy and completeness

Lecture 23: Compare Different Models for Incremental ETL

Model Description Use Case SQL Command
Appending Adds new records to existing data Incremental data growth INSERT INTO target SELECT * FROM source WHERE new
Complete Replacement Replaces entire dataset with new version Full data refresh TRUNCATE TABLE target; INSERT INTO target SELECT * FROM source
Delta Loading Loads only changed data since last load Batch updates MERGE INTO target USING source ON keys WHEN MATCHED THEN UPDATE SET ... WHEN NOT MATCHED THEN INSERT ...
Merge (In-place update) Combines insert and update operations High-volume, complex updates MERGE INTO target USING source ON keys WHEN MATCHED THEN UPDATE SET ... WHEN NOT MATCHED THEN INSERT ...

Key Focus on Incremental ETL:

  • Efficient updates: Only process new or changed data
  • Reduced processing time and resource usage
  • Improved data freshness and timeliness

=> Bring the data warehouse up to date.


Lecture 24: Explore the Role of Data Transformation

Transformation Purpose
Data Cleaning Remove errors and inconsistencies
Data Enrichment Enhance data with additional information
Data Aggregation Summarize data for analysis

Lecture 25: More Common Transformations Within ETL

Transformation Example Category
Filtering Remove irrelevant data Cleansing
Sorting Arrange data in a specific order Enriching
Normalization Standardize data formats Cleansing
De-Normalization De-normalize data to Big Table Enriching
Unification Combine data from multiple sources Enriching
Deduplication Remove duplicate records Cleansing
Vertical Slicing Select specific columns from source data Cleansing
Horizontal Slicing Filter rows based on specific criteria Cleansing
Data Correction Fix errors in data values Cleansing
Aggregation Summarize data by grouping and calculation Aggregating

Lecture 25: More Common Transformations Within ETL - Examples

| Transformation | Example | Sample Table | | —————— | —————————————— | —————- | | Filtering | Remove orders with total < $100 | sql SELECT * FROM Orders WHERE TotalAmount >= 100 | | Sorting | Arrange customers by last purchase date | sql SELECT * FROM Customers ORDER BY LastPurchaseDate DESC | | Normalization | Standardize phone numbers to (XXX) XXX-XXXX| sql UPDATE Customers SET Phone = CONCAT('(', SUBSTRING(Phone, 1, 3), ') ', SUBSTRING(Phone, 4, 3), '-', SUBSTRING(Phone, 7, 4)) | | De-Normalization| Combine customer and order data | sql SELECT c.*, o.OrderID, o.OrderDate FROM Customers c JOIN Orders o ON c.CustomerID = o.CustomerID | | Unification | Merge data from multiple source tables | sql SELECT * FROM Orders_2023 UNION ALL SELECT * FROM Orders_2022 | | Deduplication | Remove duplicate customer records | sql WITH DedupCTE AS ( SELECT *, ROW_NUMBER() OVER (PARTITION BY Email ORDER BY CustomerID) AS RowNum FROM Customers ) DELETE FROM DedupCTE WHERE RowNum > 1 | | Vertical Slicing| Select specific columns from source | sql SELECT CustomerID, FirstName, LastName, Email FROM Customers | | Horizontal Slicing| Filter rows based on specific criteria | sql SELECT * FROM Products WHERE Category = 'Electronics' AND Price > 500 | | Data Correction| Fix errors in data values | sql UPDATE Products SET ProductName = TRIM(ProductName) WHERE ProductName LIKE ' %' OR ProductName LIKE '% ' | | Aggregation | Summarize data by grouping and calculation | sql SELECT Category, AVG(Price) AS AvgPrice, COUNT(*) AS ProductCount FROM Products GROUP BY Category |

These examples showcase common ETL transformations with sample SQL queries, demonstrating how data can be manipulated and prepared for loading into a data warehouse.


Lecture 26: Implement Mix-and-Match Incremental ETL

Feed Frequency Batch ETL Micro-Batch ETL Real-Time ETL
Daily Suitable Overkill Overkill
Hourly Possible Suitable Possible
Near Real-Time Unsuitable Suitable Optimal
Real-Time Unsuitable Possible Optimal

Choose the suitable, not the right


Assignment: ETL Fundamentals Design


Scenario:

You are a data engineer at an e-commerce company. The company wants to create a data warehouse to analyze sales data, customer behavior, and product performance. Your task is to design an ETL process that will extract data from various sources, transform it, and load it into the data warehouse.

Task:

  1. Design an ETL process for the given scenario.
  2. Compare ETL and ELT models for this use case.
  3. Implement sample transformations and incremental loading strategies.

Requirements:

  • Data Sources: Online transaction system, customer database, product catalog
  • Target: Data warehouse with fact and dimension tables
  • Frequency: Daily updates

Deliverables:

  1. ETL process diagram
  2. Written explanation of the ETL process
  3. Comparison of ETL vs ELT for this scenario
  4. Sample SQL or pseudocode for key transformations
  5. Strategy for incremental loading

Solution Proposal:


1. ETL Process Diagram:

graph TD A[Online Transaction System] --> D[Staging Area] B[Customer Database] --> D C[Product Catalog] --> D D --> E[Transform] E --> F[Load] F --> G[Data Warehouse] G --> H[Sales Fact Table] G --> I[Customer Dimension] G --> J[Product Dimension] G --> K[Time Dimension]

2. ETL Process Explanation:

  1. Extract: Data is extracted daily from the online transaction system, customer database, and product catalog.
  2. Stage: Extracted data is loaded into a staging area for preprocessing.
  3. Transform: Data undergoes cleaning, validation, and transformation to fit the data warehouse schema.
  4. Load: Transformed data is loaded into the appropriate fact and dimension tables in the data warehouse.
  5. Incremental Update: Only new or changed data since the last ETL run is processed.

3. ETL vs ELT Comparison:

ETL:

  • Pros: Data is cleaned before loading, reducing storage needs.
  • Cons: May be slower for large data volumes.

ELT:

  • Pros: Faster initial loading, more flexible for big data.
  • Cons: Requires more storage in the data warehouse.

For this scenario, ETL is recommended due to the need for data cleaning and the moderate data volume.


4. Sample Transformations:

-- Customer dimension update (Type 2 SCD)
MERGE INTO Customer_Dim AS target
USING (SELECT * FROM Staging_Customer) AS source
ON (target.CustomerID = source.CustomerID)
WHEN MATCHED AND (
    target.Email <> source.Email OR
    target.Address <> source.Address
)
THEN
    UPDATE SET EndDate = GETDATE(), IsCurrent = 0
WHEN NOT MATCHED
THEN
    INSERT (CustomerID, Name, Email, Address, StartDate, EndDate, IsCurrent)
    VALUES (source.CustomerID, source.Name, source.Email, source.Address, GETDATE(), NULL, 1);

-- Sales fact table load
INSERT INTO Sales_Fact (OrderID, CustomerID, ProductID, DateID, Quantity, Revenue)
SELECT
    s.OrderID,
    c.CustomerID,
    p.ProductID,
    d.DateID,
    s.Quantity,
    s.Price * s.Quantity AS Revenue
FROM Staging_Sales s
JOIN Customer_Dim c ON s.CustomerID = c.CustomerID AND c.IsCurrent = 1
JOIN Product_Dim p ON s.ProductID = p.ProductID
JOIN Date_Dim d ON s.OrderDate = d.Date
WHERE s.OrderDate > (SELECT MAX(OrderDate) FROM Sales_Fact);

5. Incremental Loading Strategy:

  • Use change data capture (CDC) or timestamps to identify new or changed records.
  • Maintain a control table to track the last processed timestamp for each source.
  • Only extract and process data that has changed since the last ETL run.
  • Implement error handling and logging for failed records.
  • Use MERGE statements for efficient upserts in dimension tables.
  • Append new records to fact tables after deduplication.

This solution provides a comprehensive approach to designing and implementing an ETL process for the e-commerce company’s data warehouse, ensuring efficient data integration and analysis capabilities.


Lecture 27: Summarize ETL Concepts and Models

Concept Summary
ETL Extract, Transform, Load
ELT Extract, Load, Transform
Incremental ETL Efficient updates with CDC, Delta, Merge

Section 5: Data Warehousing Design: Building Blocks


Lecture 28: Data Warehousing Structure Fundamentals

Component Purpose
Data Sources Origins of data
Staging Area Intermediate data processing
Data Warehouse Centralized storage for analysis

Lecture 29: Deciding What Your Data Warehouse Will Be Used For

BI Category Proposed Data Model
Reporting Star schema for efficient querying
Analytics Snowflake schema for complex analysis
Data Mining Denormalized tables for pattern discovery

Lecture 30: The Basic Principles of Dimensionality

  • Bring dimension context to measurement
  • Adding By and For in objects your want to measure
Wording Usage Example
By Indicates grouping or categorization Sales by Region
For Specifies the subject or time period Revenue for Q1 2023

Example of measurement with dimension: “What was the total revenue by product category for the first quarter of 2023?”

In this question:

  • “total revenue” is the measurement (fact)
  • “by product category” adds the dimension context (using “By”)
  • “for the first quarter of 2023” specifies the time period (using “For”)

Lecture 31: Compare Facts, Fact Tables, Dimensions, and Dimension Tables

Type Description Example
Facts Quantitative data, measurements Sales amount, revenue
Fact Tables Store facts with keys to dimensions Sales table, transaction table
Dimensions Contextual data Date, Product, Customer
Dimension Tables Store dimension attributes Date table, Product table

Note: Dimension Hierarchy. E.g: one hierarchy, three level dimentions Example: Product < Product Family < Product Category (Snowflake Schema)


Lecture 32: Compare Different Forms of Additivity in Facts

| Form | Description | Can Be Summed? | | —————– | ————————————- | —————— | | Additive | Can be summed across all dimensions. These facts can be aggregated without restrictions. | Yes, across all dimensions | | Semi-Additive | Can be summed across some dimensions, but not all. Typically, these can’t be summed over time. | Yes, but not across all dimensions | | Non-Additive | Cannot be summed across any dimension. These facts require other methods of aggregation. | No |

Examples:

  • Additive: Total revenue can be summed across products, regions, and time periods.
  • Semi-Additive: Inventory levels can be summed across products and locations, but not over time.
  • Non-Additive: Customer satisfaction scores cannot be summed; they are typically averaged or analyzed individually.

Lecture 33: Compare a Star Schema to a Snowflake Schema

Aspect Star Schema Snowflake Schema
Structure Central fact table with dimension tables Normalized dimension tables, multiple levels
Pain Point: Complexity Simpler structure, easier to understand More complex due to normalization
Pain Point: Performance Faster queries, fewer joins Slower queries due to multiple joins
Pain Point: Storage Higher storage usage, data redundancy More storage efficient
Pain Point: Maintenance Easier to maintain and update Complex maintenance, table relationships
Dataset Size Suitability Better for smaller to medium-sized datasets Efficient for larger, complex datasets
Query Type Suitability Ideal for read-heavy analytical queries Better for changing dimension attributes
Pain Point: Flexibility Less flexible for dimension changes More flexible for dimension changes
Pain Point: ETL Process Simpler ETL processes Complex ETL to maintain normalization

Same dimentions, Different table representation


Lecture 34: Database Keys for Data Warehousing

They are built and connected though Key

Key Type Purpose Created In
Primary Key Unique identifier for records Database
Foreign Key Links between tables Database
Surrogate Key Substitute for business keys ETL or Data Warehouse
Natural Key Real-world unique identifier Source System

Example of Entity Relationship

erDiagram CUSTOMER { int CustomerID PK string Name string Email } ORDER { int OrderID PK int CustomerID FK date OrderDate } PRODUCT { int ProductSK PK string ProductName float Price } SOURCE_SYSTEM { string SSN PK string Name date DateOfBirth } CUSTOMER ||--o{ ORDER : places ORDER }o--|| PRODUCT : contains SOURCE_SYSTEM ||--o{ CUSTOMER : populates

Lecture 35: Summarize Data Warehousing Structure

Component Role
Data Sources Origins of data
Staging Area Data preparation
Data Warehouse Central repository
Presentation Layer Data access and reporting

</div>


Quiz 2: Data Warehouse Structure**


Question 1: You are a data architect for a large retail company that wants to implement a new data warehouse to analyze sales trends and customer behavior. The company has multiple data sources, including point-of-sale systems, online transactions, and customer loyalty programs. Which data warehouse architecture would best suit their needs for efficient querying and reporting?

A) Operational Data Store (ODS) B) Data Mart C) Star Schema D) Third Normal Form (3NF)

(Correct Answer: C)


Question 2: A financial services firm is planning to build a data warehouse to support complex analytical queries and provide a historical view of their data. They have a requirement to minimize storage space and maintain flexibility for future changes in their data model. Which schema design would you recommend for their data warehouse?

A) Star Schema B) Snowflake Schema C) Flat Schema D) Entity-Relationship Model

(Correct Answer: B)


Question 3: As a data engineer for a healthcare organization, you are tasked with designing the ETL process for their new data warehouse. The organization needs to ensure data quality and perform necessary transformations before loading into the warehouse. Which component of the data warehouse architecture would be most critical for this purpose?

A) Presentation Layer B) Staging Area C) Data Mart D) OLAP Cube

(Correct Answer: B)


Section 6: Design Facts, Fact Tables, Dimensions, and Dimension Tables


Lecture 36: Introduction to Dimensional Modeling

Thinking Flow:

  1. Identify Measurements:
    • Sales amount
    • Quantity ordered
  2. Identify Context:
    • Customer information
    • Product details
    • Order date
  3. Identify Facts:
    • Sales amount
    • Quantity ordered
  4. Identify Dimensions:
    • Customer dimension
    • Product dimension
    • Date dimension

Lecture 36: Introduction to Dimensional Modeling

Dimension Tables:

Customer Dimension:

  • CustomerSK (Surrogate Key)
  • CustomerID (Natural Key)
  • Name
  • Email

Product Dimension:

  • ProductSK (Surrogate Key)
  • ProductID (Natural Key)
  • ProductName
  • ProductCategory (Heirarchy)
  • Price

Date Dimension:

  • DateSK (Surrogate Key)
  • Date
  • Day
  • Month
  • Year

Lecture 36: Introduction to Dimensional Modeling

Fact Table:

Sales Fact:

  • OrderID (Natural Key)
  • CustomerSK (Foreign Key)
  • ProductSK (Foreign Key)
  • DateSK (Foreign Key)
  • Quantity
  • SalesAmount

This model allows for efficient analysis of sales data by customer, product, and time period.


Lecture 36: Introduction to Dimensional Modeling

Concept Purpose
Dimensional Modeling Design data structures for efficient querying
Star Schema Central fact table with dimensions
Snowflake Schema More normalized schema
  • In the Big Warehouse Architecture, We want to boosting the performance by removing contrainst between table (optimized for reading) and mimic the FK with logical FK.
  • Local FK is processed in ETL part

Lecture 37: Design Dimension Tables for Star Schemas and Snowflake Schemas

Schema Dimension Table Design
Star Schema Denormalized dimensions
Snowflake Schema Normalized dimensions

Lecture 38: The Four Main Types of Data Warehousing Fact Tables

Type Description
Transaction Detailed, operational data
Periodic Snapshot Data at regular intervals
Accumulating Snapshot Cumulative data over time
Factless Fact Records without measurable facts

</div>


Lecture 39: The Role of Transaction Fact Tables

Role Purpose
Capture Events Store individual transactions
Detail Analysis Analyze operational metrics
Historical Data Provide detailed historical records

Lecture 40: The Rules Governing Facts and Transaction Fact Tables

Rule Description
Granularity Level of detail
Consistency Uniform data format
Aggregation Summarization and roll-ups

Lecture 41: Primary and Foreign Keys for Fact Tables

Key Purpose
Primary Key Unique identifier for records
Foreign Key Links to dimension tables

Lecture 42: The Role of Periodic Snapshot Fact Tables

Role Purpose
Data Points Capture snapshots at regular intervals
Trend Analysis Analyze changes over time
Historical Context Provide time-based analysis

Lecture 43: Periodic Snapshots and Semi-Additive Facts

Type Description
Periodic Snapshots Data captured at set intervals
Semi-Additive Facts Can be summed across some dimensions

Assignment 3: Transaction and Periodic Snapshot Fact Tables

Task Description
Design Fact Tables Create transaction and snapshot tables
Implementation Apply rules and keys
Examples Provide sample data and queries

Lecture 44: The Role of Accumulating Snapshot Fact Tables

Role Purpose
Long-Term Data Track cumulative data over time
Complex Analysis Analyze events over a lifecycle
Performance Manage large datasets efficiently

Lecture 45: Accumulating Snapshot Fact Table Example

Scenario Details
Sales Orders Cumulative sales data for each order
Inventory Levels Track stock changes over time

Lecture 46: Why a Factless Fact Table isn’t a Contradiction in Terms

Aspect Explanation
Definition Table without measurable facts
Purpose Capture events or transactions
Use Case Tracking occurrences and relationships

Lecture 47: Compare the Structure of Fact Tables in Star Schemas vs. Snowflake Schemas

Aspect Star Schema Snowflake Schema
Structure Central fact table, simple design Complex, normalized design
Query Performance Faster queries due to denormalization Slower due to multiple joins
Maintenance Easier to maintain More complex maintenance

Lecture 48: SQL for Dimension and Fact Tables

SQL Operations Purpose
Select Retrieve data
Join Combine tables
Aggregate Summarize data

Lecture 49: Summarize Fact and Dimension Tables

Table Type Summary
Fact Tables Store quantitative data
Dimension Tables Store descriptive attributes

Section 7: Managing Data Warehouse History Through Slowly Changing Dimensions


Lecture 50: Introduction to Slowly Changing Dimensions

Type Description
Type 1 Overwrite old data
Type 2 Track historical changes
Type 3 Track limited history

Lecture 51: Slowly Changing Dimensions (SCDs) and Data Warehouse History

SCD Type Purpose
Type 1 Update current records
Type 2 Preserve historical records
Type 3 Track recent changes only

Lecture 52: Design a

Type 1 SCD

Aspect Description
Overwrite Replace old data with new
Implementation Simple design and maintenance

Lecture 53: Design a Type 2 SCD

Aspect Description
Historical Records Maintain history of changes
Implementation More complex design

Lecture 54: Maintain Correct Data Order with Type 2 SCDs

Aspect Description
Data Order Ensure proper sequence of changes
Tracking Changes Maintain accurate history

Lecture 55: Design a Type 3 SCD

Aspect Description
Limited History Track a small number of changes
Implementation Moderate complexity

Lecture 56: Summarize SCD concepts and implementations

Concept Summary
Type 1 Overwrites old data
Type 2 Tracks historical changes
Type 3 Tracks limited history

Lecture 57: Introduction to ETL Design

Aspect Description
ETL Design Strategies for designing ETL processes
Architecture Design considerations for ETL systems

Lecture 58: Build your ETL Design from your ETL Architecture

Aspect Description
Design Translate architecture into design
Implementation Develop ETL processes and workflows

Section 8: Designing Your ETL


Lecture 59: Dimension Table ETL

Aspect Description
Extract Pull data from sources
Transform Apply transformations
Load Load data into dimension tables

Lecture 60: Process SCD Type 1 Changes to a Dimension Table

Aspect Description
Type 1 SCD Handle updates with overwrite
Implementation Simple updates to dimension tables

Lecture 61: Process SCD Type 2 Changes to a Dimension Table

Aspect Description
Type 2 SCD Handle historical changes
Implementation More complex updates to dimension tables

Lecture 62: Design ETL for Fact Tables

Aspect Description
Extract Pull data from sources
Transform Apply transformations
Load Load data into fact tables

Lecture 63: Summarize ETL Design

Aspect Summary
ETL Design Strategies and processes
Implementation Application of ETL concepts

Lecture 64: Introduction to Data Warehousing Environments

Aspect Description
Data Warehousing Environments Overview of environments and setups
Cloud vs. On-Premises Compare different environments

Lecture 65: Decide Between Cloud and On-Premises Settings for Your Data Warehouse

Aspect Description
Cloud Benefits and considerations
On-Premises Benefits and considerations

Lecture 66: Architecture and Design Implications for Your Selected Platform

Aspect Description
Architecture Design considerations for the platform
Design Implications Impact of choice on design

Quiz 4: Data Warehousing Environments

Focus Topics
Environments Cloud, On-Premises
Architecture Design implications and considerations
Examples Case studies and real-world examples

Section 9: Selecting Your Data Warehouse Environment


What is Data Vault ? How it helps in data architect system ?

  • Data Vault 2.0 is a modeling methodology used in data warehousing to build flexible and scalable data architectures. It involves modeling the data warehouse as a series of hubs, links, and satellites that can be easily extended and modified as new data sources are added.

  • Data Vault is a concept increasingly used for NoSQL databases where semi-structured and unstructured data is processed.
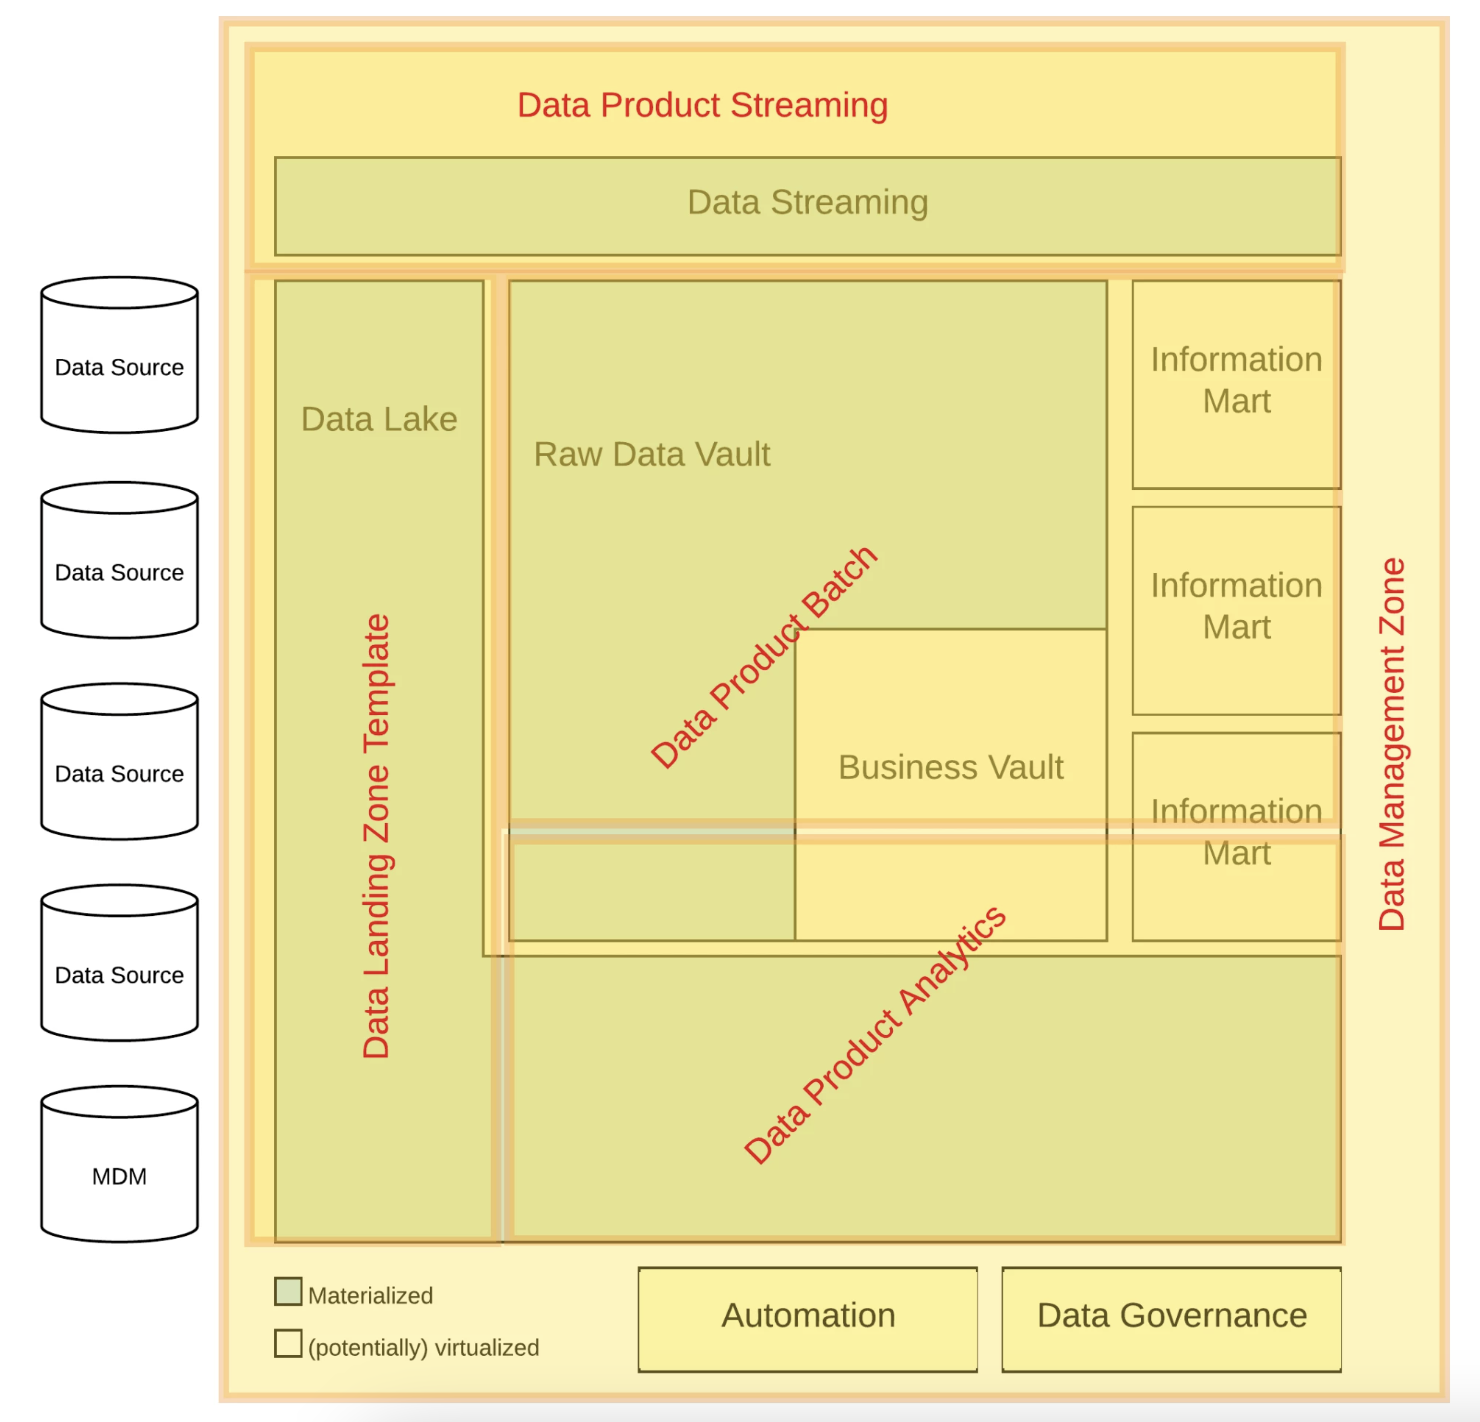
alt text

Key Concepts of Data Vault

  • Data lake for staging purposes, loaded and ingested by Script, data pipeline and which is persist data.

  • Due to sources are changing time over time, considered data lake is semi-structure and schema revolution.

  • Information Marts matches the definition of data mart, that is defined by end-user and often modeled using dimensional model, or even flat-and-wide entity (fully denormalized entity).

  • Data lake is functionally oriented and modeled by source system. on the other hand, information mart is modeled by information requirement ==> both layers are modeled independently from each other. It is fundamental for de-coupling and business changing.

  • Because in reality, the L-shape of the Raw Data Vault is due to the fact that some of the enterprise data is good enough for reporting, a Business Vault entity only exists if a business rule needs to be applied.

  • The similar L-shape of the data lake has other reasons: first, the data lake should have a dual-use. It’s not only used by the Data Vault team to build the data analytics platform, but also by the data scientists to develop more ad-hoc solutions.

  • The message queue on top of the architecture diagram is not only used to capture real-time data but also to deliver real-time information.

Data Vault Design Pattern with Azure Cloud

Azure provides several services that can be used to implement a Data Vault 2.0 architecture, including:

alt text

  1. Azure Data Factory: This service can be used to extract, transform, and load (ETL) data from various sources into a centralized storage location, such as Azure Data Lake Storage or Azure Blob Storage. Data Factory provides support for a wide range of data sources, including structured, semi-structured, and unstructured data.

  2. Azure SQL Database: This is a fully managed relational database service that can be used to store the hub and link tables in a Data Vault 2.0 architecture. SQL Database provides built-in support for advanced security features such as row-level security and data masking.

  3. Azure Analysis Services: This is a fully managed analytics engine that can be used to build and deploy business intelligence models based on the data stored in the hub and link tables. Analysis Services provides support for a wide range of data visualization tools, including Power BI.

  4. Azure DevOps: This is a set of services that can be used to manage the development and deployment of the Data Vault 2.0 architecture. DevOps provides support for continuous integration and continuous deployment (CI/CD) pipelines, automated testing, and deployment monitoring.

Conclusion

By using these Azure services, organizations can implement a highly scalable and flexible Data Vault 2.0 architecture that can easily accommodate changes in data sources and business requirements. Additionally, Azure provides advanced security features and compliance certifications that can help organizations meet their data security and privacy requirements.

Important: Technology stack should only serve as a blueprint for the platform.

Subscribe Newsletters To Get Updated

Subscribe

* indicates required